In this article, we will see how Mean, Median and Mode help Knowing Central Tendency of Data. Mean, Median and Mode all are used in statistic to analyze center tendency of a population or sample. Learn the basics of Statistics using data visualization a Data-Driven Approach.
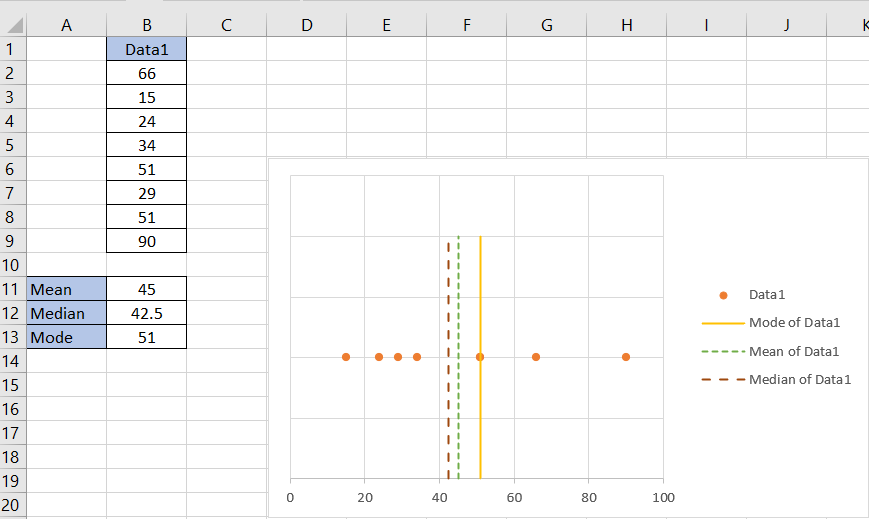
Mean: The mean is found by adding all scores and then dividing by the number of scores. For example, the average of 66, 15, 24, 34, 51, 29, 51 and 90 is 360 divided by 8, which is 45.
Median: The median reflects the middle value when observations are ordered from least to most. For example, the median of 66, 15, 24, 34, 51, 29, 51 and 90 is 42.5.
Mode: The mode reflects the value of the most frequently occurring score. For example, the mode of 66, 15, 24, 34, 51, 29, 51 and 90 is 51.
Let’s plot these observations on Excel Horizontally and analyze it. Please refer our article, if you have doubt over How to Excel plot single column as horizontal line.
When a distribution of scores is not too skewed, the values of the mode, median, and mean are similar, and any of them can be used to describe the central tendency of the distribution as seem below.
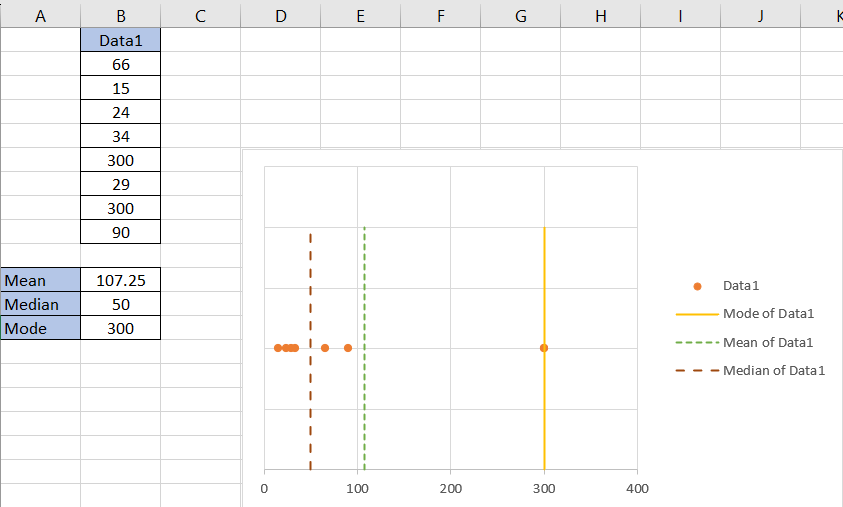
When a distribution of scores is skewed ( replace 51 with a skewed value 300 ), the values of the mode and mean will not be able to describe the central tendency of the distribution. 7 out f 8 data is showing left side of the mean and mode line , where as median still make sense . In this case Median will be best to describe central tendency of the distribution as seem below.
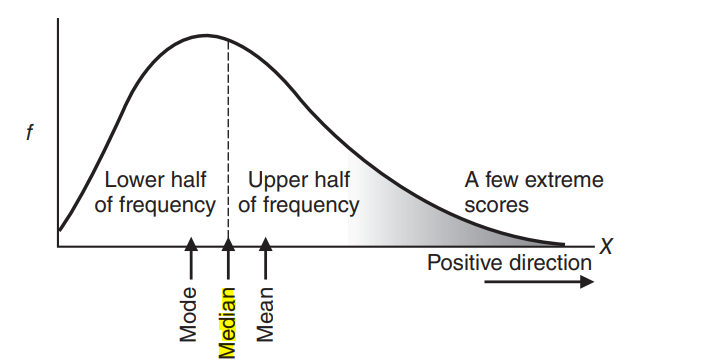
In Positively skewed distribution Mean Exceed Median.
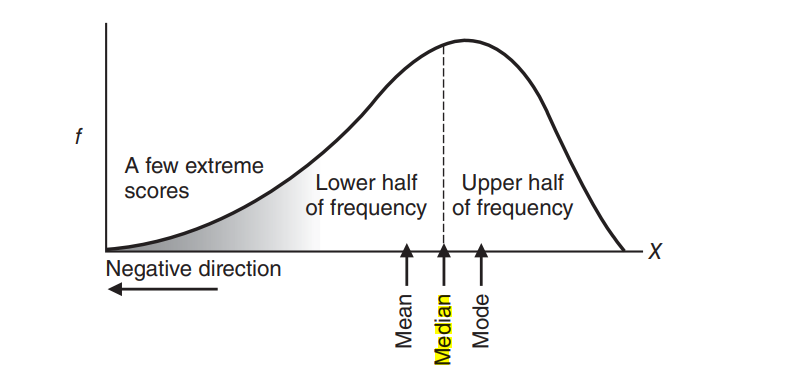
In Negatively skewed distribution Median Exceed Mean .
Guidance from Prof. Sriram Sankaranarayanan , IIMA & Reference: Statistics (11th edition) by R S Witte and J S Witte